Venice is exposed to flooding tides, locally called "acqua alta " (literally: high water) that is generated by sirocco wind storms, and amplified by the luni-solar astronomical forces as well as by the free oscillations of the Adriatic sea. The key problems are: (i) the expected rise of the sea level, (ii) the sinking of the ground, for the extraction of water from subsoil, and (iii) the exchanges between sea and lagoon waters that in the past century have been modified for the excavation of new channels for the passage of tanks (channel Vittorio Emanuaele: 1910-33 and channel Malamocco: 1965-75). The sea surges that flood Venice, not only provoke damage to goods and population, but also impregnate walls with sea salt, which in a short destroy mortar, marble, limestone, brick... As a matter of fact, the sea surges were rare in the past centuries and more and more frequent today.
Regular instrumental records of the sea level started from 1872, and they show that in the period 1872-1987 the combined effect of the subsiding soil and rising sea level was a relative rise by 20 cm (Pirazzoli, 1989) or 27.5 cm (Rusconi, 1983), 12 of them occurred in the period 1950-1970 (Pirazzoli, 1982).
Looking at the documentation existing at the Water Magistrate, Venice, Rusconi (1983) studied the relative change of the sea level that caused to operate works in buildings which were arrived too close to the sea level. He found that the Ducal Palace subsided 31.3 cm since 1810, but he had also contradictory results with other buildings.
Another source of information is given by written documents of the Venice Republic, chronicles, annals, diaries that cover one millennium which describe sea surges and sometimes also the meteorological situation seen by the witness of that time. Fortunately, Venice has an accurate documentation of the events occurred in the past, with 70 km shelves only for the State Archive of the City. This uninterrupted data set which covers the time scale of more than one millennium provides a unique opportunity to know the response of the sea to the past climate changes. All of these data have been validated, controlled the date, translated, classified according the level of severity and filed in the CNR Data Bank. Among these documents, one by Zantedeschi has been found that reports the height reached by the sea water in comparison with two reference heights: the floor in San Marco and the average height of the high tides. From this document it is possible to state that since 1867 the city heart has sunk by 37 cm (Enzi and Camuffo, 1995).
In the past, the frequency of flooding surges increased a bit during the Wolf Minimum of solar activity (1282-1342). In the period culminated in 1424, 1433 and 1442 an exceptional combination of the attractive luni-solar forces with the Moon in perigee coincident with its maximum declination and the Sun and Moon are both at their greatest declination (Lamb (1972) caused an increase in the frequency of exceptional tides. Except this period, the astronomic component was of minor relevance when compared with the meteorological forcing. The only visible effect was a minor fluctuation with period 18.6 yr (i.e. lunar nutation period) superposed to the main trend. The next maximum in flooding surges occurrence was in the first half of the 16th century, during the Spörer minimum of the solar activity (1416-1534); another maximum was between 1727-1805 for the increased occurrence of the scirocco wind. We cannot assess that solar activity affected the atmospheric circulation (Eddy, 1977) generating an anomalous occurrence of Sirocco wind and sea surges during the Spörer minimum, because nothing similar was found during the other periods of reduced solar activity, i.e. the Oort Minimum (1010-1090) and the Maunder Minimum (1645-1714). Finally, an impressive increase of the flooding frequency was found since 1914, during the excavation of the first deep channel, and then more and more accelerated for to the above mentioned human activity (Camuffo, 1993).
The historical written sources are also useful to establish the seasonal regularity of the Azores anticyclone that in the warm season prevents the Atlantic depressions from entering the Mediterranean and the formation of the sirocco wind responsible for the surges. The most critical period for flooding surges was the late autumn, between October and December, and is remained practically unchanged in the whole period. Historical data (1200-1871) show a very minor secondary maximum in March (spring anomaly) that has been damped in the modern instrumental period (1872-today).
The historical written sources are of little help in establishing the average tide level before the instrumental period. We know that the combined effect of the sea level rise and soil subsidence was maximum during the past century, but nothing is known before. It is clear that any other information that may help us in the previous period is extremely precious.
Rusconi (1983) looked whether it was possible to improve our knowledge about the change of the average sea level looking at the marks "C" that can be found engraved on some buildings and the side of canals. These marks were originally posed to indicate the average level of high tides. The mark "C" is for Comune Marino, the ancient name given locally to the top of brown-green belt left by algae on the canals side. The green-brown algae (e.g. laminaria) constitute a precious biological indicator, because they live in the area which is periodically wet by tides, and the top of the green band coincides with the average high tide level. The horizontal line below the mark C indicated the level of the brown-green front. The problems he encountered were that the C marks were not many, not comparable between them because each one was engraved in an unknown and different time, and for most of them the line indicating the level was completely eroded and disappeared.
At this point the Venetian painter Antonio Canal, nicknamed Canaletto (1697-1768) may help us. Before Canaletto, artists made a quick draft on the site, and then concluded paintings in their workshops, so that their paintings include details created by the artist imagination. Canaletto needed a lot of money for his life, so that he invented a quick way to produce his paintings. With a camera obscura on the site, he projected the image of the view to reproduce on a sheet of paper, or on the canvas, and then he drawn all the contours with a pen. Canaletto was very accurate in reproducing details and had an exceptional sight as he wrote in a painting that it draw it when he was aged 68, without glasses. Two models of the original camera used by Canaletto are still preserved at the Correr Museum, Venice.
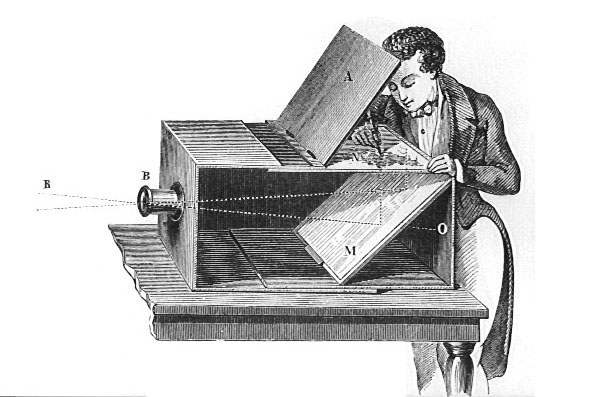
Fig.1: Priciple of operation of the Camera Obscura
Therefore, all his paintings can be considered like a real photograph, but taken one century before the invention of Daguerre (1839) ands more than one century
before the beginning of the instrumental observations (1872). This green-brown belt is found in several paintings, together with useful space references (e.g. stones on building
façades, bricks, steps). As these decorative stones are still there, we can count in the paintings how many stones lie between the algae front and a useful reference. We
can compare the level at the time of Canaletto and at present and get a quantitative evaluation of the displacement occurred in the meantime. All the paintings by Canaletto,
Bellotto, Guardi and the school of Vedutisti Veneziani (Painters of Vedutas) are very accurate in all details, reproduce the brown-green belt on a number of buildings and
canals, and they refer to the same time period.
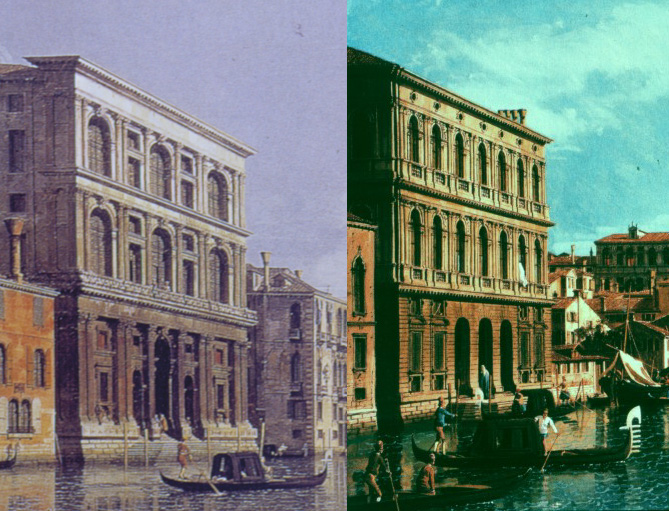
a. Canaletto, Palazzo Grimani,
Venezia
b. Bellotto, il Canal Grande, Venezia
Fig. 2 (a) A painting by Canaletto showing Grimani Palace on the Grand Canal, which is darkened by air pollution and shows the level of brown-green algae left by
the tide range; (b) another painting, by Bellotto, with the same evidence, but concerning another building on the Grand Canal. The actual displacement of the front of the algae
is found after measuring several case studies like these two examples.
References
Camuffo, D., 1993: Analysis of the Sea Surges at Venice from A.D. 782 to 1990, Theoretical and Applied Climatology, 47, 1-14.
Eddy, J.A., 1977: Climate and the changing Sun. Climatic Change, 1, 173-190.
Enzi, S. and Camuffo, D., 1995: Documentary Sources of Sea Surges in Venice from A.D. 787 to 1867. Natural Hazards, 12, 225-287.
Lamb, H.H., 1972: Climate: present, past and future, Vol.1, Methuen, London, 613 pp.
Pirazzoli, P.A., 1989: "Effetto serra" e livello marino: quali prospettive per Venezia? Ateneo Veneto 176, 7-30.
Pirazzoli, P.A., 1983: Influence des traveaux récents et des périodicités astronomiques sur l"acqua alta" à Venise: la réponse des maréographes. Oceanologica Acta, special issue, 177-184.
Rusconi, A., 1983: Il Comune Marino a Venezia: ricerche e ipotesi sulle sue variazioni altimetriche e sui fenomeni naturali che le determinano. Min. Lavori Pubblici, Ufficio Idrografico Magistrato alle Acque, Pubbl. No 157, Venice, 39 pp.